Who uses it?
International Security, Press, and Research Firms
What's it for?
A report on the state of foreign fighters
Status
Completed
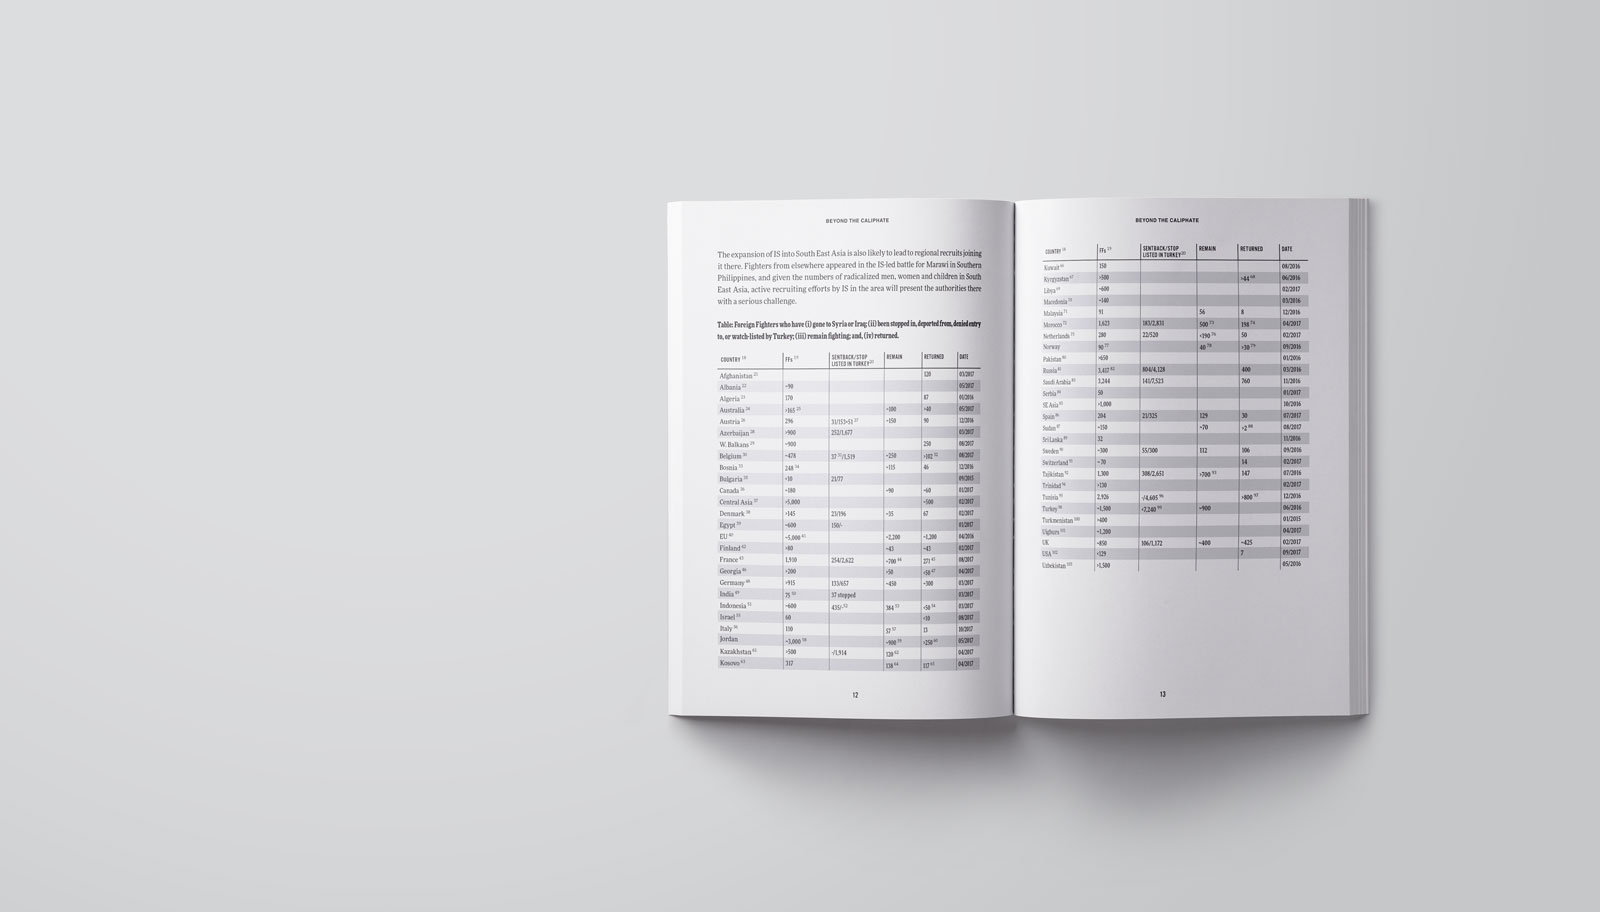
The Soufan Center
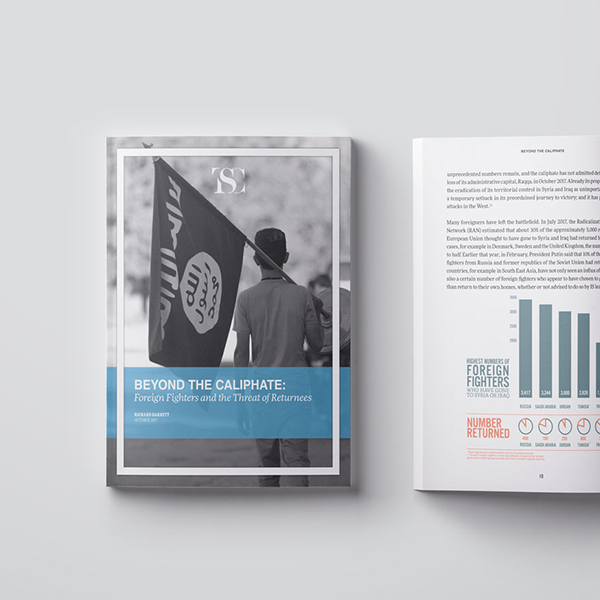
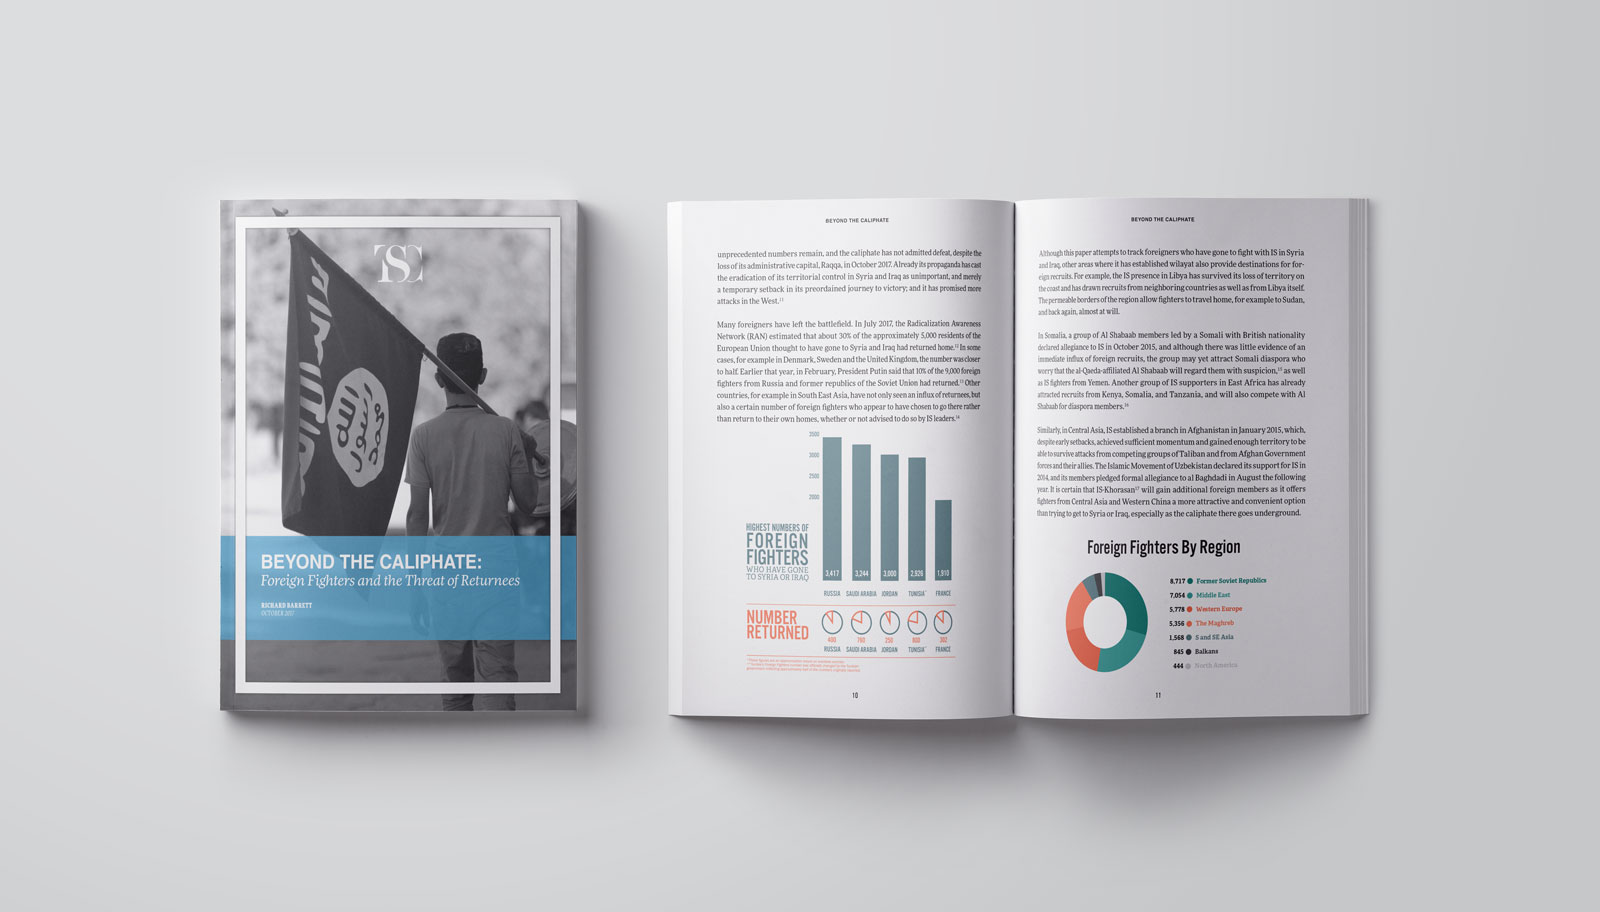
Publication design for the security industry
Reports written by The Soufan Center are deeply research intensive, therefore, infographics and well-designed tables are necessary for keeping data clean and easily digestible. Some of our favorite work stems from the need to take a huge swath of data and provide it the clean structure it needs to be easy on the eye. This includes carefully choosing color placement and typefaces to keep consistency in telling readers what the information belongs to. Categorizing data by using visual clues in type and color is the essence of scannable information.
Testimonial
"The report’s influence on policymakers, the media, and security practitioners is vast but impossible to measure."
— Meredith Stricker, Executive Director, The Soufan Center