Client
Who uses it?
What's it for?
Helping cities protect citizens through predictive policing.
What did Startstage do?
Status
Crimescape
Tracking & predicting crime
To predict risk, Civicscape strictly uses unbiased historical and live data from police departments, with other sources such as weather, to run through it's proprietary deep-learning algorithm. To prove the unbiased nature of the platform, Civicscape posts all code to the public on Github. Through machine learning, Civicscape predicts 72 hours in the future where crime is most likely to occur.
Where we began
When we began working with Civicscape, the web application was a shell with a few toggles for users to interact with the algorithm.
The first thing we did was identify the problems and future requests from core users, and the capabilities of the algorithm to solve those problems. One question from a group of core users being, "Where do I send my patrol officers, right now?"
Then we audited the original design for structure and form, which is where we discovered the map as being an important design feature.
Visualizing risk
Color and shape
We designed risk to act as a layer over the city grid forming the framework of jurisdictions (eg. Districts, Sectors, Patrols). Square cells of the grid fill with color according to their predicted risk score. The color corresponds to the crime type. The more saturated the color means there is more risk.
Mapping Data
Situational awareness
The custom map uses a majority of the screen so it was important to highlight key city features, such as train tracks, parks, and street segments. More maps were created to use for reports and other use cases.
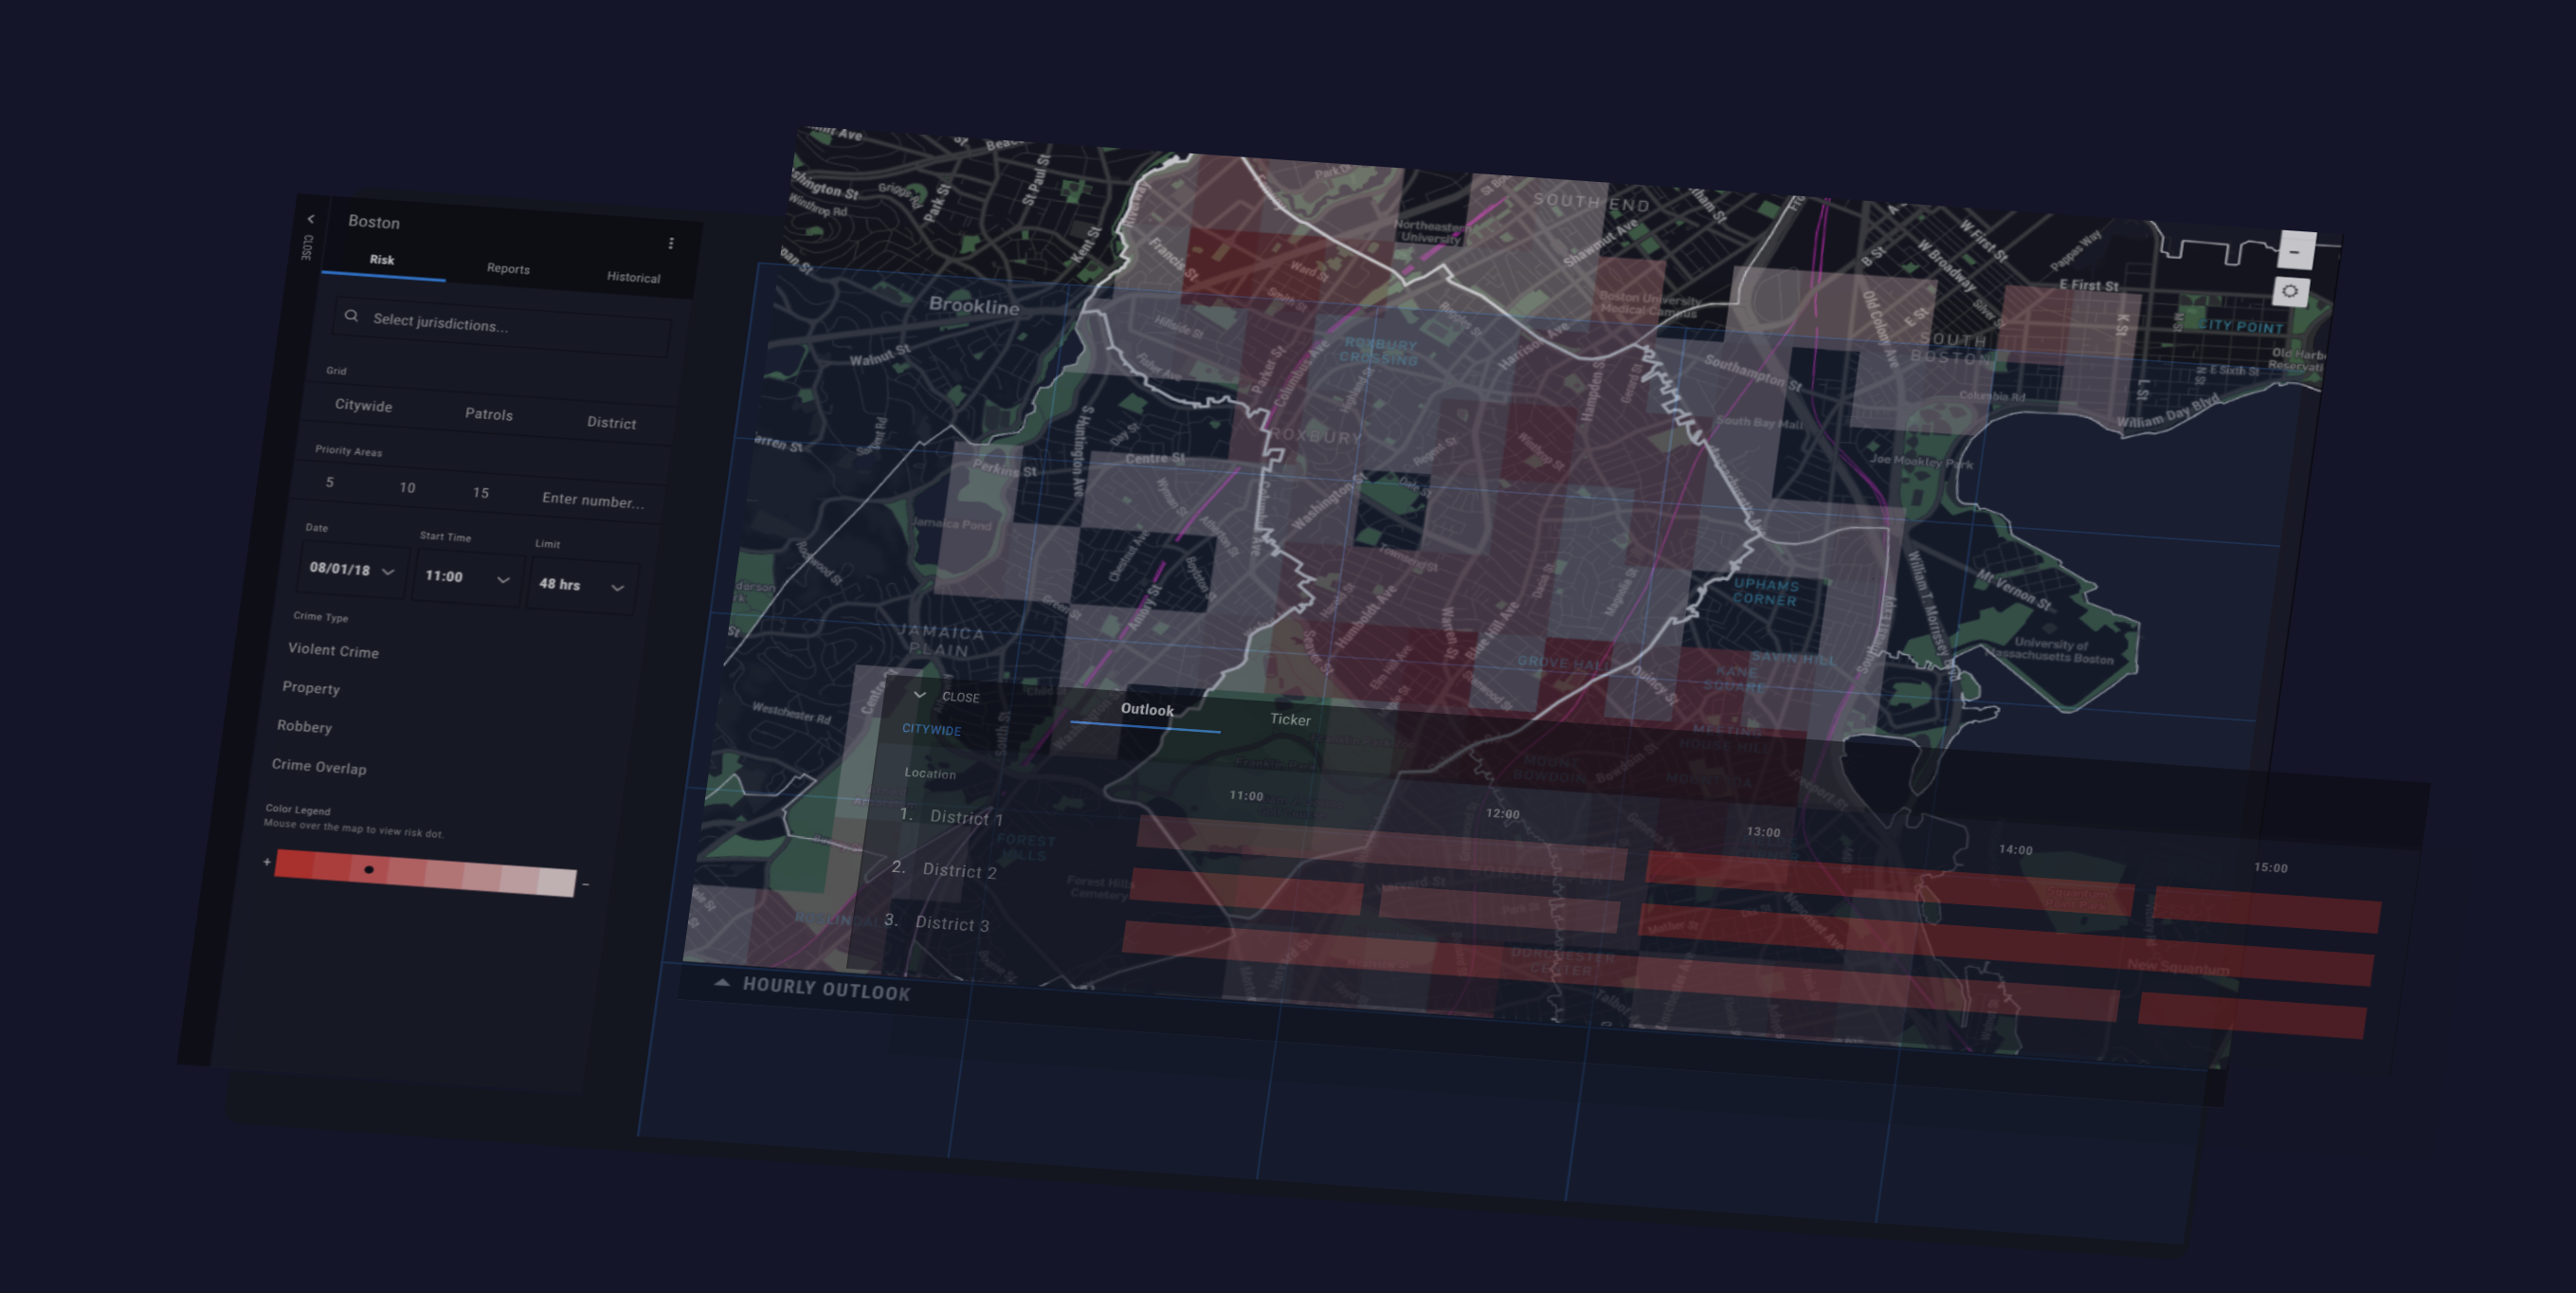
Time & space
Control panels
The location, time, and type of crime on the map is managed by the left panel. These settings carry over into Risk, Reports, and Historical views.
The bottom panel gives users a more detailed visual reference for risk changing in the selected area. There is an hour-over-hour outlook and ticker to view risk information in different ways depending on interests.
Let's chat
Have a project in mind? Send us a message here or email colin@startstage.co.